Week 2: Meal Mapping
Week 2, on February 7th, 2013, was focused on
mapping all of the energy and environmental impact that go into making a plated
meal. We mapped the energy use for two different types of meals, and for each
meal, made two separate maps associated with high impact production and low
impact production. The two mapped meals were:
- Fish, rice, carrots, apple pie, and a drink (high impact + low impact)
- Eggplant lasagna, salad, ice cream and cookies, and a drink (high impact and low impact)
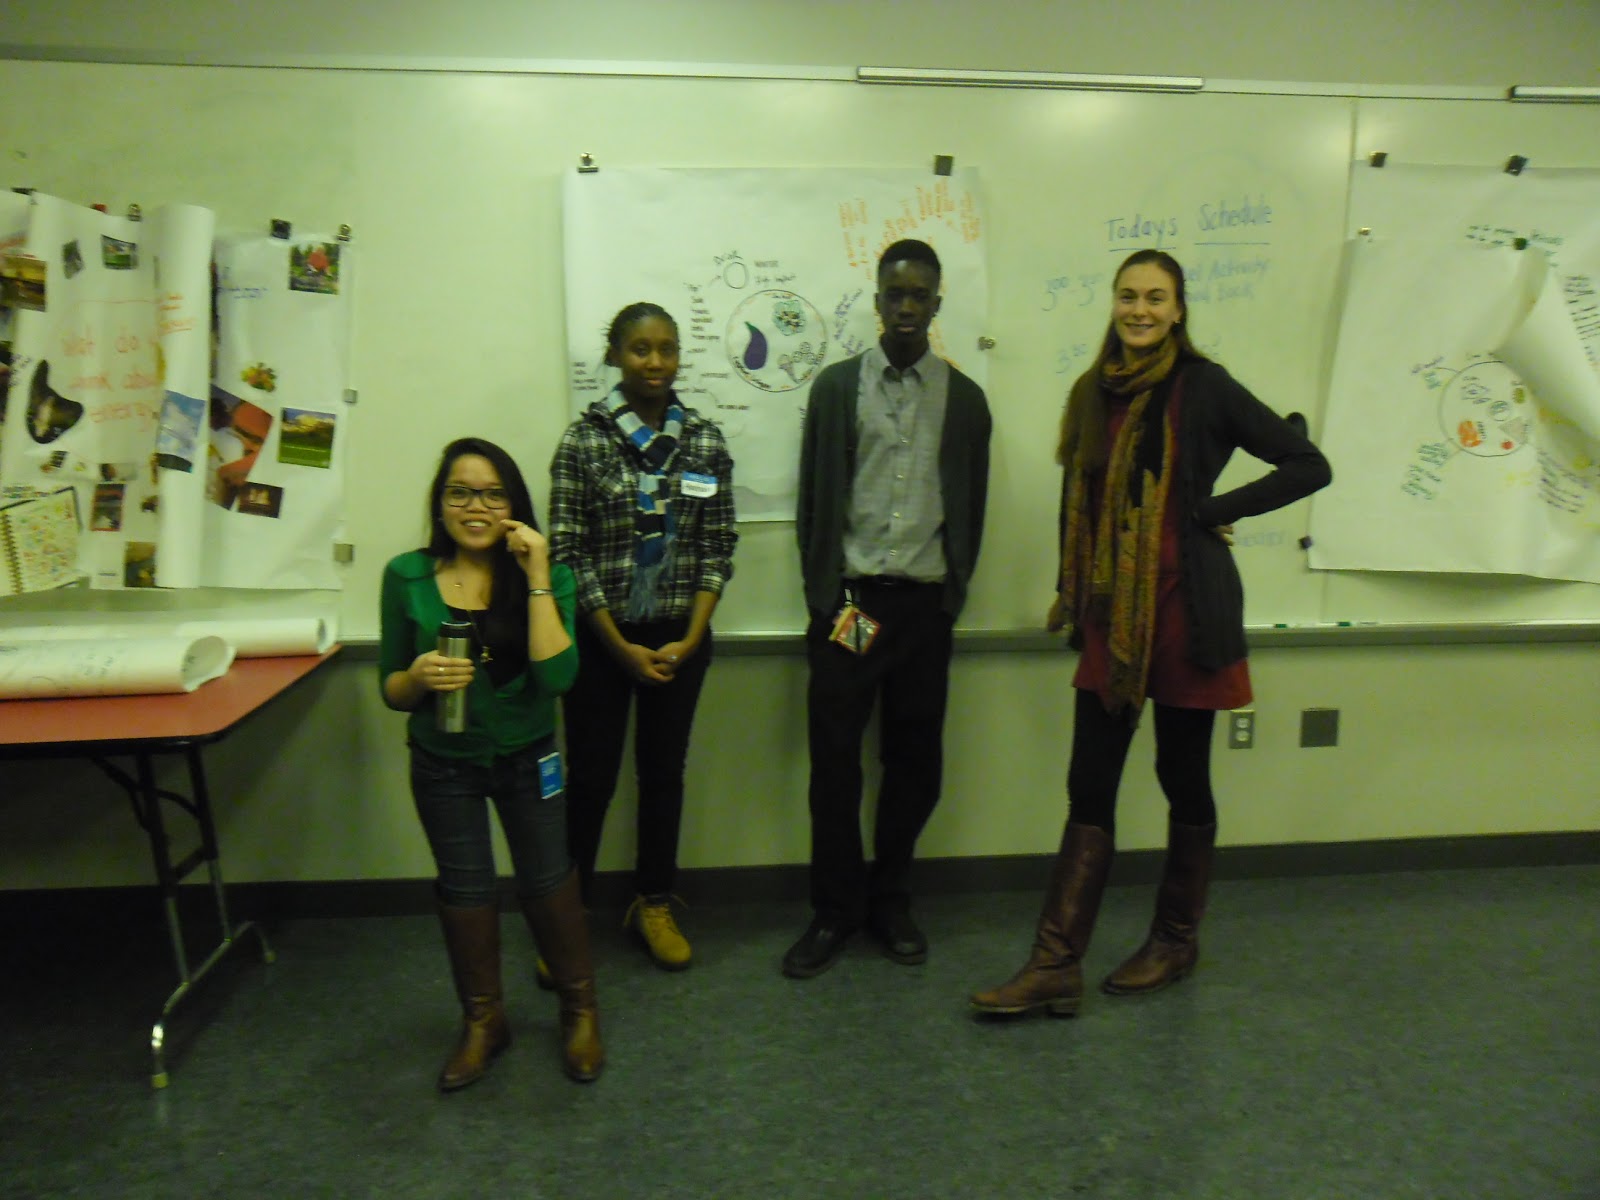
After separating into groups and documenting all the different forms of energy that pertain to the production, transportation, packaging, etc, of each individual product in the meal we presented our results to the group. We found that more local and organic methods cost less, are more sustainable, and are better for the environment. Things associated with high impact include importing, high rates of transportation, and factory packaging.
View all Week 2 photos here.


Next week we plan to go to Phipps Conservatory and the
Center for Sustainable Landscape to learn about the energy use associated with
“green buildings”. The Phipps Conservatory is an indoor botanical garden that
harbors multiple gardens and a mock Indian Forest. The Center for Sustainable
Landscape is a building that has zero net energy, and in some cases provides
energy for the Phipps Conservatory.
No comments:
Post a Comment